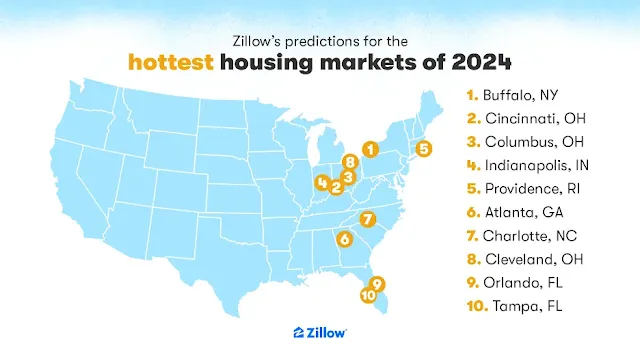
Zillow's annual predictions for the
hottest housing markets in 2024 include Buffalo, N.Y., as the top market,
followed by Cincinnati, Columbus (Ohio), Indianapolis, and Providence, R.I. The
rankings are based on factors such as expected home value growth, projected
change in owner-occupied households, job growth compared to new construction, and
other economic fundamentals.
The Midwest, Great Lakes, and South regions dominate the list, with Charlotte, last year's hottest market, still near the top. Despite recent improvements in mortgage rates, challenges like low inventory and relatively high prices are expected to persist in the housing market in 2024.
Zillow's list of the hottest
housing markets in 2024 is determined by factors such as forecast home value
growth, recent housing market activity, and projected changes in the labor
market, home construction, and homeowner households. Buffalo, N.Y., is at the
top of the list due to recent job creation outpacing new home construction
projects and expectations of stable home values.
Cincinnati ranks second, mainly because of its high market velocity, with homes typically going pending in a median of just five or six days for most months in 2023. The analysis considers these factors to identify markets with strong economic fundamentals and potential for stable home values.
Price Growth
In 2023, home value growth slowed
down, influenced largely by the highest mortgage interest rates since 2008. For
2024, only 15 out of the 50 largest markets are expected to experience home
value growth. Even the fastest-growing markets in 2023 are anticipated to see
significant slowdowns.
Hartford had the highest year-over-year home value growth among large markets in 2023 at 11%, but it is expected to decline to 0.7% in 2024. Charlotte, last year's hottest market, is expected to maintain steady growth at 1.2%, while Buffalo's typical home value is projected to decline by 0.2% in 2024.
Inventory & Velocity
In 2023, the inflow of new listings
slowed significantly compared to the previous year, leading to multi-year lows
in for-sale inventory. Low-inventory markets, where buyers faced challenges in
finding homes and properties sold quickly in 2023, are expected to continue
experiencing high demand relative to supply in 2024.
The markets with the fewest listing days per home in 2023, indicating fast-selling homes, were Hartford, Cincinnati, and Columbus.
Demographics
In 2024, only 14 of the 50 largest
markets are expected to see an increase in homeownership. Columbus leads in the
for-sale market lift, with a trend suggesting a formation of 11.4% more owning
households (assuming homes are available). Austin and Memphis follow at 9.7%
and 9.6%, respectively. Markets with negative demographic pressure, where
homeownership is expected to decrease, include Birmingham (-25%), San Diego
(-21.8%), and Oklahoma City (-20.2%).
The coolest metro areas of 2024, characterized by expected annual home value declines and a projected decline in owner-occupied households, include New Orleans, San Antonio, Denver, Houston, and Minneapolis. New Orleans is expected to have the most significant decline, with a 6% fall in typical home values in 2024.
Methodology
The final index relied on the
following information:
- Anticipated yearly appreciation in home values
for November 2024
- Predicted acceleration in home value appreciation
from November 2023 to November 2024
- Duration of home listings from January 2023 to
November 2023
- Change in total non-farm employment over two
years per two-year residential building permit total
- Estimated alteration in owner-occupied households
from 2023 to 2024
Metrics were standardized based on available metro-level data, using standard deviations from the mean. Mean and standard deviation were weighted according to housing unit counts and capped at ±1.96 to avoid penalizing metros for extreme data points. The final index represents an average across metrics, with standardized home price appreciation (HPA) acceleration down-weighted by half.
Listing days per home, representing
inventory and velocity, utilized Zillow data for Median Days to Pending and New
Listings.
For job market and building data,
the ratio of employment change to the total permitted residential structures
was calculated. Total non-farm employment (seasonally adjusted) came from the
U.S. Bureau of Labor Statistics Current Employment Statistics survey, using the
3-year change from November 2020 to November 2023. Building permit data was
sourced from New Private Housing Structures Authorized by Building Permits,
summing over the 2-year period from November 2020 to November 2023.
To evaluate demographic pressure in the for-sale housing market, projected changes in homeowner households from 2023 to 2024 were considered. This projection factored in population aging and migration patterns, using data from the American Community Survey (ACS) from 2021 (5-year sample) and 2022 (1-year sample) obtained from IPUMS USA, University of Minnesota.
The assessment involved a two-stage process. The first stage utilized a larger 5-year sample to calculate entry and exit from the population by age (due to birth, migration, death). The second stage applied age-specific rates of population change to the 1-year sample, iterating over 2023-2024 for ages 18-89.
Keeping the observed age-specific
share of the population who is the head of household of an owner-occupied
housing unit constant, the percentage change in the number of owner-heads
expected in 2024 compared to 2023, by age, was estimated. Summing these changes
provided a demographically expected rate of increase in homeowner households in
2024.
All population and owner-headship
counts were smoothed across ages over a 5-year centered window before
calculating rates and changes.


0 Comments